
AERB has set up a Remote Sensing and Geographic Information System (RS-GIS) facility at Safety Research Institute, Kalpakkam with the objective of generation of digital database on nuclear installations for carrying out environmental impact assessment, creation of information system for emergency management and to promote safety research related to regulatory function. Development of baseline data to independently carry out environmental impact assessment in Nuclear Power Plant sites, validation of satellite derived sea surface temperatures, studies related to application of RS-GIS in atmospheric dispersion and tsunami inundation modelling, development of decision support systems for emergency management, etc. are some of the important research activities being carried out. Further, collaborative projects with premier academic institutions such as Anna University, Bharathidasan University are in progress.
Environmental baseline data for 50 km radius around Kudankulam Nuclear Plant site (KKNPP), on Surface Water bodies, Lithology, Soil, drainage network, Road network, Digital elevation model (DEM), land use/ land cover and village map has been generated. These data can be employed to evaluate various environmental scenarios with regard to environmental assessment and emergency preparedness.
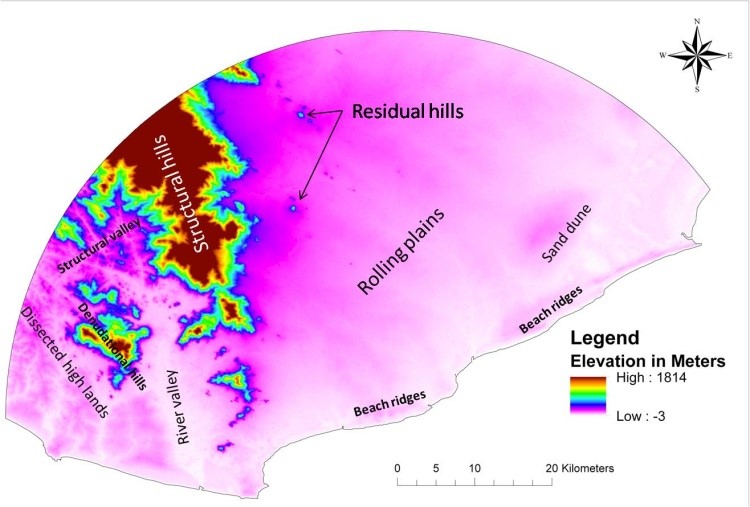
DEM showing various morphological features around KKNNP area
Sea surface temperature studies, employing multi-dated satellite thermal infra-red imagery was carried out. The aim of the study is to identify the temporal characteristics of the thermal plume signature around a coastal NPP site due to condenser coolant discharges. The task includes,
Baseline study on the prevailing sea surface temperature pattern,
Processing and conversion of Satellite data to derive Sea Surface Temperature by employing suitable algorithms and
Estimation of difference between actual and measured temperature.
Baseline Study
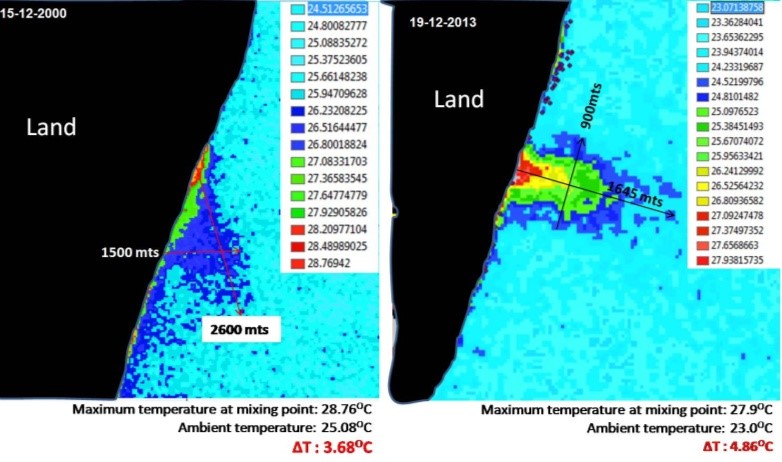
Prior to the study on satellite based mapping of Sea Surface Temperature pattern, a preliminary baseline survey is carried out to understand the existing thermal discharge pattern at Kalpakkam site. This work involves in situ measurement of sea surface temperature (skin temperature) at intake and mixing zone i.e. the zone where the heated water/effluent meets the receiving body (i.e. final outlet) and calculation of ∆T. The in situ sea surface temperature at condenser coolant intake and mixing zone are periodically measured by employing YSI multi parameter device during the study period October 2009 to December 2012. Totally, 29 measurements were made at the above locations. The surface temperature is measured at site by dipping the probe into the water body directly. From the difference between mixing zone and intake temperature, ∆T is calculated.
The study indicate that ∆T was low during northerly current than the southerly current as latter was comparatively weaker than the former. It attributed the influence of the long shore current speed in the cooling and dispersion pattern of heated water discharge.
Mapping of Sea surface Temperature using satellite Thermal Infra Red data for the period (2000-2013)
Subsequent to the baseline study, multi-dated satellite Thermal Infra Red (TIR) image assessment has been done to demonstrate the spatial and temporal characteristics of the thermal plume signature and to determine what extent the MAPS condenser discharge influence the temperature distribution of the coastal water around the Kalpakkam coast.
A total of 95 satellite Thermal Infra Red data (2000 to 2013) from Landsat were analyzed to know the thermal plume character with respect to seasons. The satellite data is processed to convert the Digital Numbers into brightness temperature. Also, the shape, dimensions and spreading pattern of the thermal plume are observed. The data is classified into three seasons, via. northern, southern and transitory. The seasonal behavior of the thermal plumes is also observed. From this study, it is observed that the ∆T is in the range of 0.86oC to 6.26oC
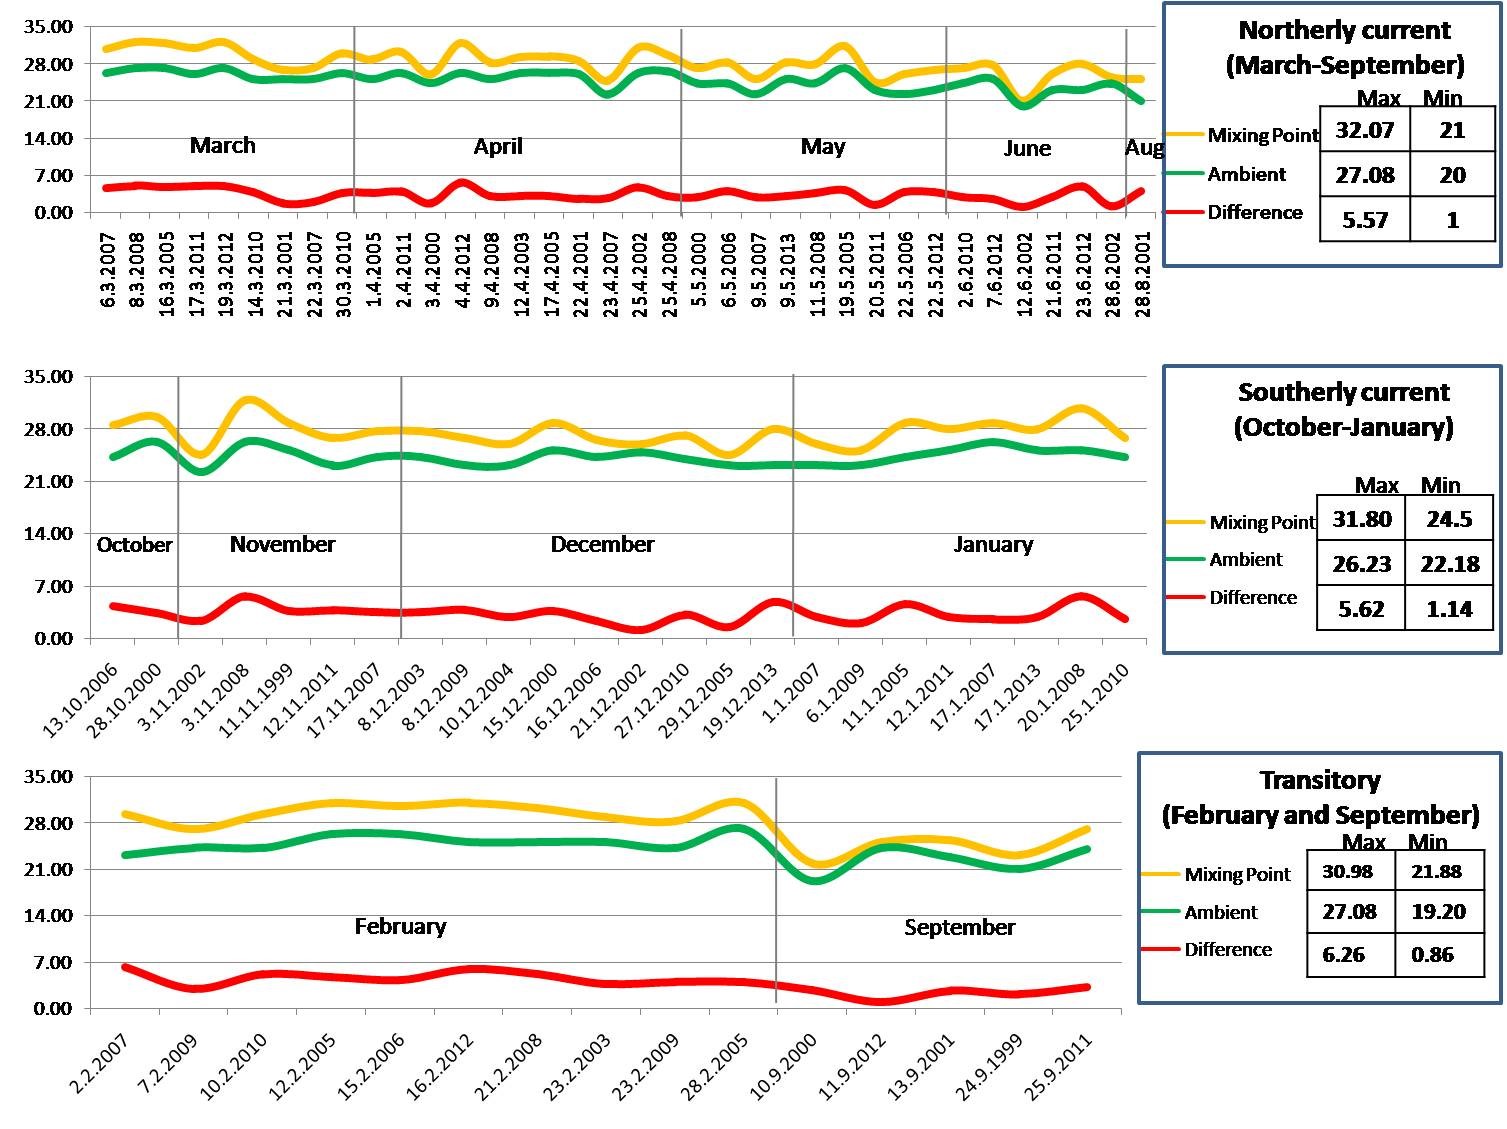
Seasonal behavior of the thermal plume
Estimation of difference between satellite derived and insitu measured SST.
To calculate the difference between actual and satellite derived temperature (i.e. to validate the satellite derived temperature by comparing ‘in situ’ measured temperature) along Kalpakkam Sea, a boat expedition corresponding to the day of satellite pass on Kalpakkam has been conducted. Satellite derived SST was compared with ‘in situ’ SST and it was observed that the satellite derived SST shows lower than the in situ SST (1.5oC -4.5oC).
‘insitu’ measurement of sea surface temperature at Kalpakkam Sea
A satellite derived sea surface temperature data (post commissioning period) for the period July 2013 to February 2014 are generated by processing Landsat 7 and Landsat 8 thermal infra red data. The satellite digital numbers are converted into temperature data by employing image processing software. One such processed data is shown. The analysis based on the data observed during a short period on the post commission sea surface temperature shows that the plume spreads over 2 sq.km area and the temperature difference between intake and mixing zone at receiving body ranges from 0.30C to 3.10C.
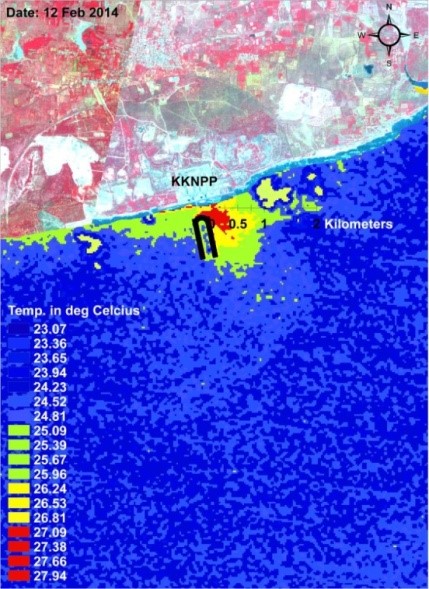
Processed LANDSAT ETM+ TIR B62 data showing Sea surface temperature distribution around KKNPP. (Land portion overlapped with visible band imagery)
The Tsunami, which struck the east coast of India on 26th December 2004, caused huge damage to life, property and environment. Kalpakkam located in the south east coast of India is one of the areas affected by the tsunami. A slew of remedial measures were initiated at Kalpakkam in 2006 and construction of coastal armoring in the form of Tsunami Protection Wall (TPW) of 3.2 km length was one of them. A study was undertaken to assess the impact of this TPW on the surroundings based on periodic measurements of High Water Line (HWL) before and after construction of the wall. As the residential area at Kalpakkam is located between fishing hamlets at northern and southern side, it is necessary to understand the impact of TPW, if any, in the surrounding area and on the fishing hamlets. Towards this assessment, high resolution satellite data such as Quickbird and IKONOS were employed (for the years 2002, 2003, 2009 and 2011) to measure the HWL. In addition, monthly beach profiles were carried out to measure the sedimentation pattern at selected transects for the year 2009.
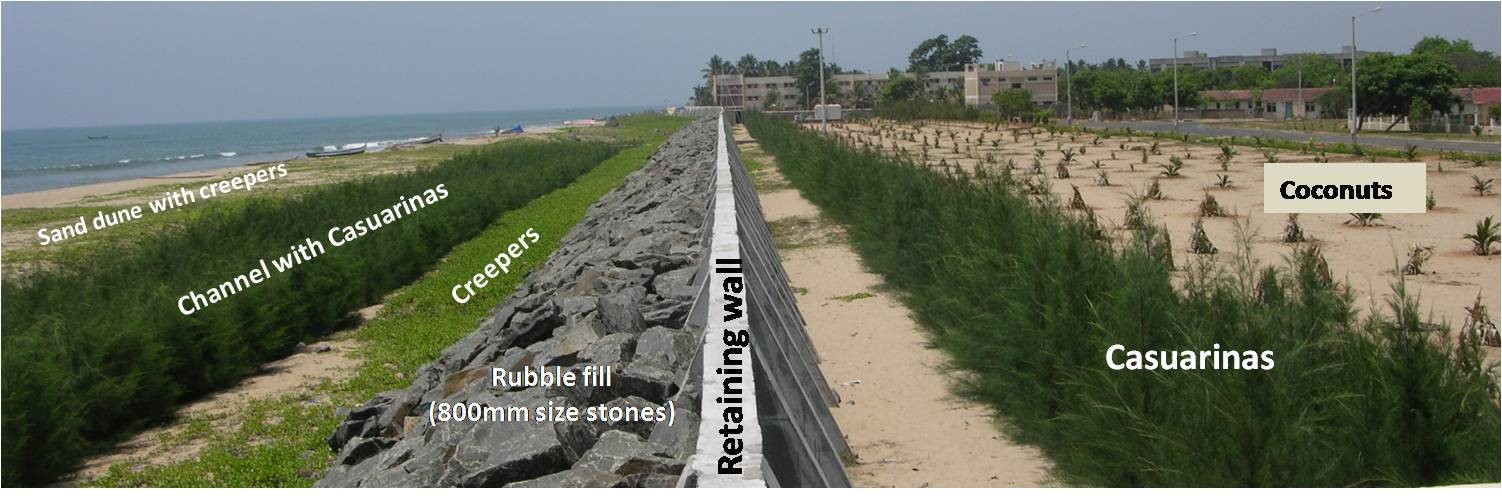
Typical elements of Tsunami Protection Wall constructed along Kalpakkam Township
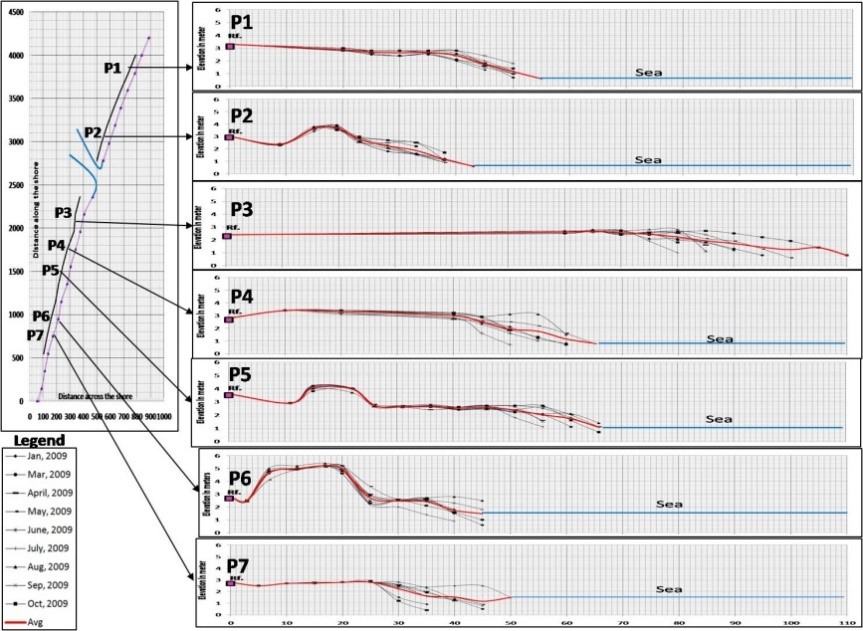
Sedimentation pattern (accretion/erosion) observed along Kalpakkam coast
The average variation in the position of HWL between pre- and post- construction period clearly indicates that the response of beach is uniform along armored and unarmored beach as the TPW was constructed ≈40 meters away from the HWL. The detailed investigations and analysis revealed no significant impact on the beach morphology and sedimentation patterns due to the construction of TPW, within the residential areas as well as at fishing hamlets. There is no significant impact in front, behind and at both ends of the armoring.
A combined outfall channel (with guided bund and tsunami protection and shore protection wall) was constructed to discharge the thermal effluent of PFBR and MAPS. To assess the environmental impact, high resolution satellite data for the pre and post construction period was analysed. The High Water Line (HWL) digitized from the data was compared and image analysis is performed to identify the changes in the morphology along the Kalpakkam coast due to impact of the wall. The initial observation shows that there is no significant change in the high water line. However, minor changes are observed in the sedimentation pattern both the corner of the wall. Due to this structure there is no impact is observed in the nearby environment.
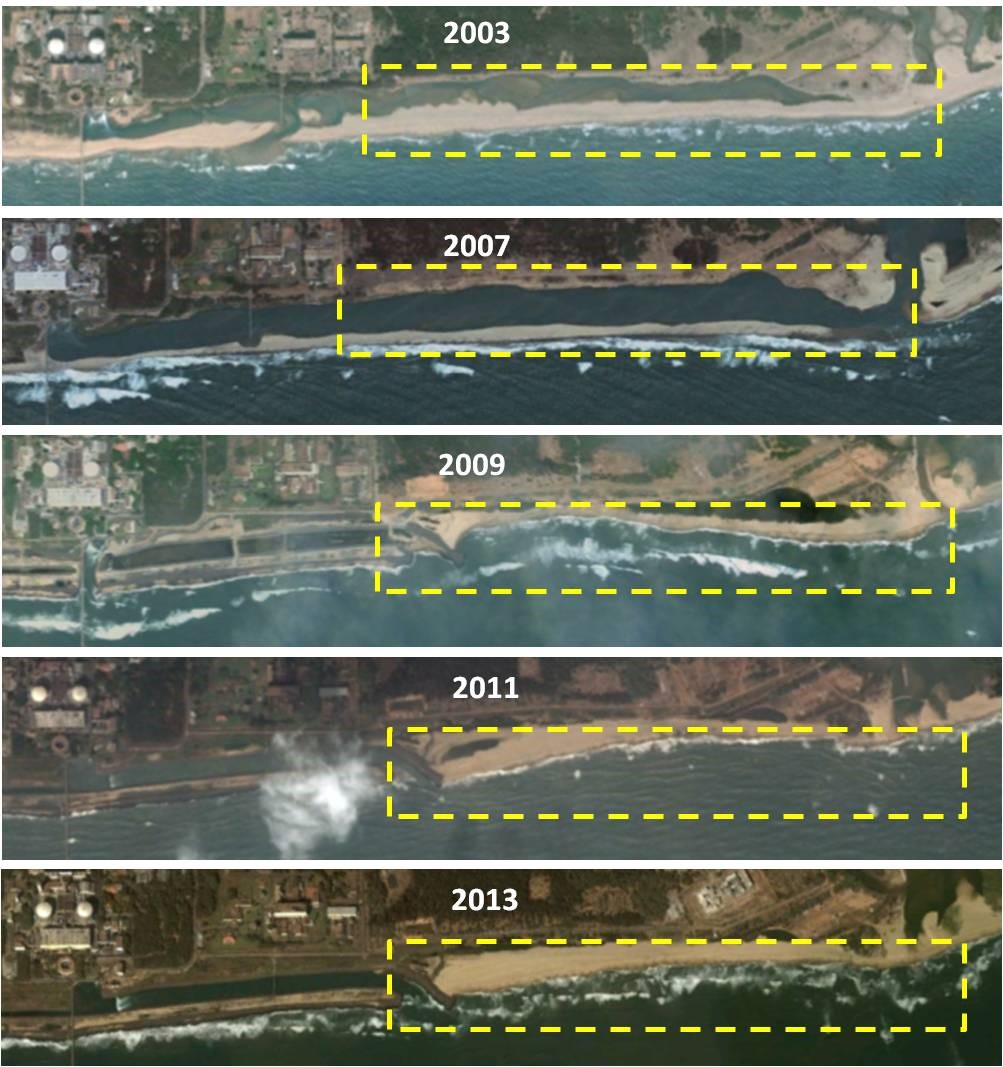
Disappearance/disuse of old canal due to construction of new canal at the northern end of the canal
As part of the NEMIS activity, a user-friendly information system for off-site emergency management during nuclear accidents is developed at SRI with the available RS-GIS facility. The system called NEMIS (Nuclear Emergency Management Information System) for Kalpakkam site. After a detail review of the system, the same will be extended further to all sites.
The information system has been created for the Emergency Planning Zone of the MAPS identified in the Manual on Emergency Preparedness published by Kalpakkam DAE Centre. This includes exclusive zone, sterile zone and emergency planning zone. This decision support system will provide the site specific information and plume details, such as plume direction, areas affected, population to be evacuated, shelter details, etc. The system contain information on population density, village boundary map with socio-economic pattern, sector map, rallying post, etc. collected from various authorized sources such as census department, environmental survey laboratory, etc. Information is provided under three broad categories, viz., Village information, plume information and emergency planning.
The village information will give basic information such as village name, population and area of the village in square km for 30 km around MAPS. The plume information menu will give information on direction of plume movement and detailed information on the area of impact. The third, emergency planning will give information on the shortest route to reach the rallying posts, the buses required for evacuation, the facility available in the rally points etc. This information system is a Graphical User Interface based customization using VB code integrated with GIS software.
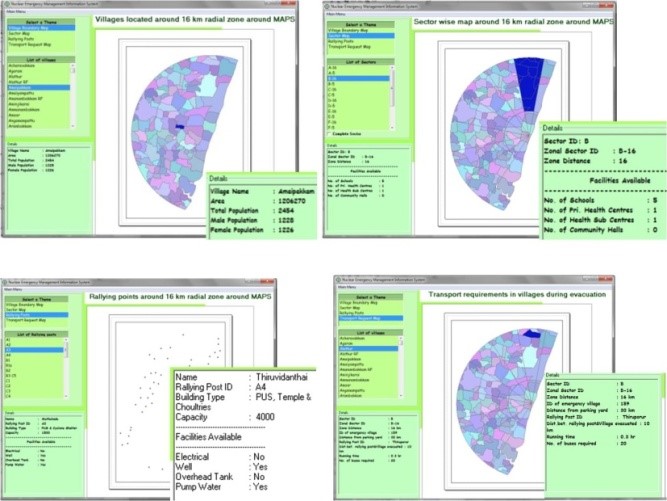
Different type of information available at NEMIS
By using this information system, one can visualize the site information, plan the preparedness for off-site emergency management during real emergency as well as drills. The required site specific GIS maps were generated and included in the system.
The database on volcanoes located in the vicinity of Indian subcontinent (between 400 to 1200 longitudes and between -600 to 400 latitudes) is developed based on a survey of past records and a review of the scientific literature. The data on volcanic events are gathered from scientific and scholarly sources, regional and worldwide databases, individual event reports, and unpublished works. This database is intended for use as ready reference for regulatory purposes.